Bar Chart and Line Chart (Info)
For last few days, I am a lot busy. I’ve been working on GDI+ and my studies of .NET 2.0 are in the backdrop.I have created a chart control. In this post I am only posting a list of features I have completed and I am currently working on. Also included is the snapshot of the control. I’ll post the details of the control in some other post after all this got over.
The controls are created for windows application.
The features provided in the charts are:
- you can place the chart in front, center, back of the container
- You can select Line Graph or Bar Graph for the specified value
- The user can change the graph type at runtime
- The graph control can be bound to a data source.
- Tooltips are available when the mouse hovers over a bar.
- The depth of the container is customizable
- The values to be provided at the cross of the line chart
- Tooltip at the cross of the line chart
- The lines on the container are customizable, if width is less than a specified pixel height (25 is set because text displayed on Y axis will need some spacing between multiple values)
- If a value larger than the current height of the graph is added to the list, the chart will change its max value and reduce the size of previous bars, in case of bar graph/position of previous cross, in case of line graph.
- The front, right and top color of the background can be changed by the user.
- The front, right and top colors of the bars can be changed separately, in bar graph.
- The color and thickness of the line, in line graph, is also customizable.
Features I am working on:
- Tooltips have to provide a link to open other window
- Provide Captions for X and Y dimensions
- Provide values for X and Y dimensions
- Provide Caption for the chart itself
- Provide support for multi valued bar.
- The depth of the bars has to be customizable
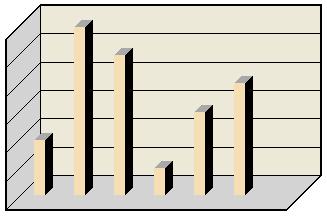
The bar chart looks like this
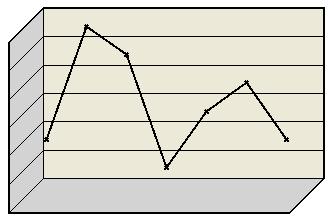
The line chart looks like this
If you have any comments/suggestions please let me know at mnd.world@gmail.com
The sample is available at http://www.mndtechnologies.com/Projects/Charts/Charts.zip
posted by mnd @ 1:26 AM
0 comments
![]()
